My original research question was: Were students who enrolled in the Program to address their developmental needs remotely during the pandemic able to achieve proficiency? Are student outcomes (e.g. Program completion and proficiency) the same or different than in previous terms?
THE DATASET
I planned to answer these questions using data from the CUNY remediation program (i.e. the Program) that I support in my role as a research analyst at the CUNY Central Office of Research, Evaluation, and Program Support (REPS). After spending much of the pandemic trying to understand how the transition to remote instruction was affecting students who enrolled in, and staff who teach for, the Program I was very curious to see how proficiency gains and withdrawal rates were going to compare to previous terms.
Despite my high hopes at the time of the final project proposal, we have been unable to finalize outcomes for any 2020 students, so I do not have the data required to address the original research questions. While it’s always difficult to finalize reporting in a timely fashion, 2020 has posed a particular challenge because of the significant changes in remediation policy introduced for CUNY’s Spring 2020 enrollees. In place of the standardized placement tests (ACCUPLACER and CAT-W) used to assign students to developmental education pathways in the past, CUNY created a proficiency index. Students now qualify for remediation based on their proficiency index score, which weights high school grades, Regents exams, and SAT scores to determine a students’ propensity for passing an entry-level course.
This change in policy has forced me to revisit the data source and logic used to establish a students’ initial remedial need(s). Without a confirmed remedial need, one cannot become proficient, which is the Program’s primary objective (and thus the most important metric we report on). Prior to 2020, we pulled all student test scores prior to their enrollment in the Program to confirm a student’s remedial need(s). From Spring 2020 onward, we need to rely on the absence of proficiency “milestone” in CUNY First. A high enough score on the proficiency index or the passing of a remedial course triggers a proficiency milestone in CUNY First. The absence of a math, reading or writing milestone in the term a student was admitted indicates that they have a remedial need in the subject (math, reading or writing). A CUNY First milestone in the subject after program participation indicates that the student has gained proficiency. Unforeseen circumstances took the milestones data tables offline for October and most of November, so I was unable to re-write the syntax and export outcomes for campus review without delaying the final project.
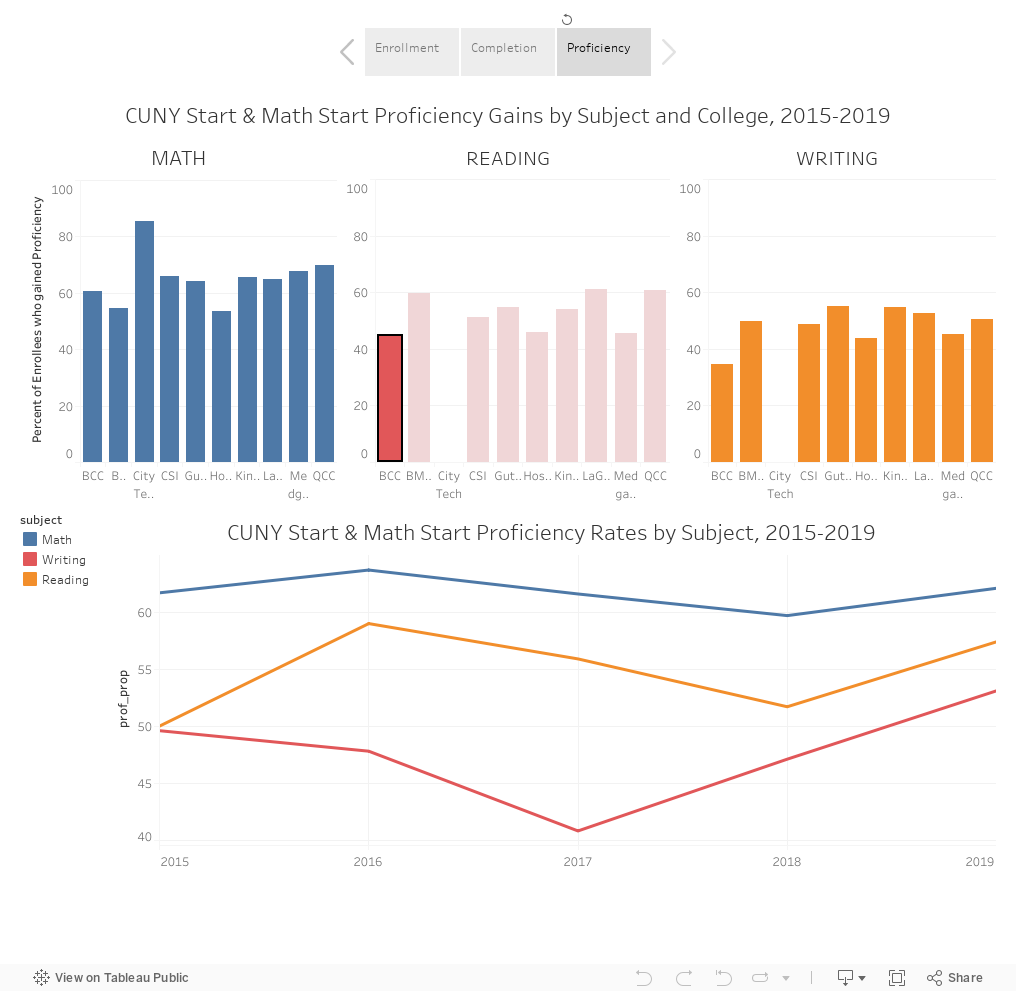
After coming to terms with this issue of timing, I decided to reframe the visualization with the policy shift in mind. Instead of the transitional timeframe I had planned on analyzing (Fall 2018 through Fall 2020, which would provide two years of baseline outcomes to compare 2020 outcomes with), I opted to create a data set that includes all Program enrollees Spring 2015 through Fall 2019.
USE CASE
I had initially planned to develop a report to be viewed at the campus level. We tend to report on all campuses in one place for the Central Office team, but campus -specific ad hoc requests are often made to run the same analysis. I had hoped that transitioning our reporting to Tableau would be the solution to this problem. Instead of having to produce every cut of the data for our data-hungry campuses and administrator, they could just filter the data themselves! This could theoretically free my time up to do research and pseudo-experimental analysis rather than just re-running descriptive reports. The primary obstacle to this vision is CUNY’s multi-year delay in transition all reporting to an internal Tableau server. Tableau Public is not an option due to restrictions on the storage of these personally identifiable student-level data and purchasing Tableau Desktop licenses for all interested parties was not financially viable. So, if I want to transition reporting to Tableau prior to the CUNY Tableau server coming online, I will need to export PDFs for Central Office and campus staff to review. This would negate the whole purpose of transitioning to Tableau in the first place, as staff wouldn’t be able to filter and create custom reports from a PDF.
With these limitations on the Tableau reporting infrastructure CUNY has in mind, I decided to stop trying to transition all Program reporting onto Tableau. Instead, this analysis will lay the foundation to address my original research question by establishing a baseline for Program enrollment, completion and proficiency gains prior to COVID-19 and the introduction of the proficiency index – both of which we can expect to have a substantial effect on program outcomes beginning in Spring 2019. I may not have all the information I need to address the impact of COVID-19/remote instruction question, I am building the historical context through which to consider this question once the dataset is finalized.
My audience for this question is primarily administrators associated with the developmental education program that the data set represents. Instructional staff also have an immediate interest in the outcomes of their students, but this is better addressed with student-level grades. The aggregate figures I intend to generate are more useful to the administrators making decisions about Program strategy and budgetary priorities at the University level. Other interested parties could include incoming University students with remedial needs considering the Program as a pathway to gain proficiency in key subjects and move on to credit-bearing courses, or researchers in the field of higher education who write on developmental education interventions or particular pedagogical approaches exemplified by the Program.

This entry is licensed under a Creative Commons Attribution-NonCommercial-ShareAlike 4.0 International license.